#Investing, Not Rocket Science - 13 - Markets & Portfolio, Amazon, Alibaba, Jd.Com, Rakuten, Ebay
- Ranjeet M CFTe
- Mar 20, 2023
- 3 min read
Updated: Mar 23, 2023
Welcome to this 13th post of investing, not rocket science! Investing Doesn't Have to Be Rocket Science: Our Non-Expert Guide to Portfolio Management.
Market Update:
UBS buys Credit Suisse for $3.25Bn, Credit Suisse writes-off $17Bn bonds as part of deal
ECB increases interest rates by 0.5%

US CPI for Feb increases 0.4% MoM and 6% YoY Core CPI increases 0.5% MoM.
PPI declines 0.1% MoM and 4.6% YoY. Wholesale prices continue to sees deceleration.
Eleven large US Banks deposit $30Bn into First Republic Bank to reverse effects of large customer withdrawals.
OpenAI launches new GPT-4
Samsung to invest $228 Bn into a semiconductor manufacturing plant, expected to be the largest chip factory in the world, based in South Korea.
Despite a fall in US Treasury yields and selling interest in banking stocks, equity indices closed positive in the Quarterly Options expiry week, driven by large cap stocks such as Google, NVidia and Microsoft, all of which gained more than 12% in the week. Communication (+6.9%) and Information Technology (+5.7%) were the sectors that saw the largest gains. Crude oil was down -13.4% for the week as concerns about growth resurfaced post PPI data, Gold futures were up 6.7% for the week as CPI data pointed to sticky inflation.


Portfolio Update:
Portfolio is up 0.68% while the index is down -5.6%
Portfolio out performance largely due to gradual equity exposure.
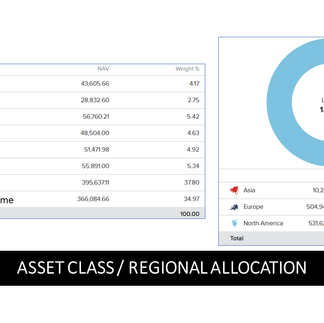
Asset Class: Gains in the portfolio driven by Bonds (35%) and Cash (38%).
Regional allocation: continues to remain under invested in Asia (1%), compared to US (51%) and Europe (48%).
Individual picks: Google sees largest gain. Biggest losses in Deutsche Bank and Citi (Financial sector). UK Gilts sees gains.
In this post, I am going to evaluate Amazon from the watch list along with some of its peers from around the world: Alibaba Group, JD.com, Ebay and Rakuten.

Company Financials:
Amazon's revenue is larger than the other four stocks put together.
Revenue to MarketCap multiple: JD has a relatively lower valuation at 0.4x followed closely by Rakuten. Valuations are high for Ebay (2.3x) and Amazon (2.0x).
Ebay has the highest earnings yield despite its high valuation at 8.1% followed by Alibaba (5.1%) and JD (3.6%).
Ebay, Alibaba and JD have positive unlevered free cash flow margin.

Valuations, Efficiency and Volatility:
Operating income margin: Highest for EBay (24.8%) followed by Alibaba (12.3%). Amazon (2.4%) and JD (1.9%).
JD and Ebay have lowest PEG ratios.
Realized volatility highest for JD and Alibaba (above 60%) and lowest for EBay and Rakuten (37%).
Price / Tangible book lowest for JD and Alibaba (2.3 and 2.8x) and the highest for EBay (28.5x).
Low Debt / Equity lowest for JD and Alibaba. Very high for Rakuten at 603%.


Trends in Company Financials
In the previous 10 year period, revenue growth has fallen the most for JD and Alibaba. Amazon and Rakuten have seen stable trends while Ebay has seen volatility in its revenue growth.
Operating income margins have been stable for Ebay, Amazon and JD. In declining trend for Alibaba and Rakuten.
Although low at 3.6%, earnings yield has improved for JD in the last ten years.
Capital Expenditure margins stable for JD, have seen increases for Amazon and Rakuten.
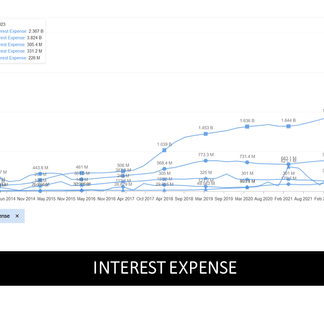
Interest expenses are highest for Amazon and Alibaba. This is likely to continue in a rising interest rate scenario.
Unlevered free cash flow: declining for all stocks, stable trend for JD.
Inventories (not in the graphs), at about 7% of revenues. Likely to be peaking out for JD and Amazon.

Fair value and upside potential
Two methods for valuation used here: Discounted Cash Flow analysis and Analyst targets. The targets set by analysts could be subjective to their individual bias to the sector or stock, while the DCF model is an objective method. Both are important and an average of the two usually provides a fair assessment.
On average, Alibaba offers the highest potential upside followed by JD and Ebay.
Summary:
Based on this evaluation, I am going to add JD.com to the portfolio with a 3% exposure. Ebay ticks a few boxes, however, the trends are volatile. Amazon has stable trends and ticks a few boxes, however, it is expensive and has negative free cash flow.

On the charts, stock price for JD is seeing a declining trend and is sensitive to Govt policies in China.
However, in my opinion, this is true for stocks in any country.
This week, I continue to evaluate stocks. I have delayed a post on real estate stocks until the FOMC interest rate decision, financial projections and press conference this week. As equity markets become volatile, I am also going to evaluate hedges to the equity exposure.
Thanks for your time!
Watch the videos of this series on our social media pages.
Please subscribe, follow, like!